One of the most resource-intensive operations performed by Power BI is refreshing datasets. When performing a refresh, the Power BI Service must allocate enough memory and compute to perform all of the steps specified in the PowerQuery steps, streaming in all the rows required by the refresh, then compress them all into a dataset. All of this affects your data sources because each dataset may have multiple data sources.
This means it's important to keep an eye on when refreshes are happening, to see how many are happening at the same time. This is important to answer two questions:
- On a Capacity – i.e., when running refreshes with limited total compute, based on your SKU level – how many refreshes are running concurrently? This is a question of fitting refreshes into the compute available on the Capacity hosting the datasets and dataflows.
- On Datasources - how many concurrent refreshes are they serving? E.g., for a relational database source, how many datasets are issuing queries to that database concurrently? This is a question of compute load on some resource other than Power BI.
These questions are very useful to answer, but not answered in any built-in reporting or monitoring in Power BI. Thus, they fall in a category of building a solution, finding a suitable open source offering, or buying a solution. There are a number of solutions for this, which we will not discuss in depth here. We include a brief appendix to this post with a high level review of available solutions that either are helpful or include the reporting discussed here.
The goal is to help Power BI Administrators and Fabric Administrators avoid future issues by spreading and optimizing the workload created by refreshes. This is a challenge since refreshes can be scheduled or initiated by users without any Admin involvement. To achieve this, Admins need to both understand the timing of data latency required by the business and a way to understand what else is happening at the same time.
Using built-in refresh monitoring to see concurrency
Here are some options for using the built-in monitoring tools to capture this information.
The Fabric Monitoring Hub
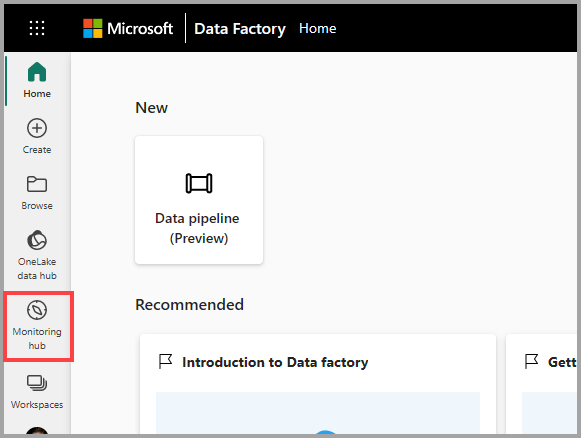
This year Microsoft added the "Monitoring Hub" icon on the left. Let's see how we could use that to detect concurrent refreshes.
Here's what is displayed by default in the Refresh Monitoring hub:
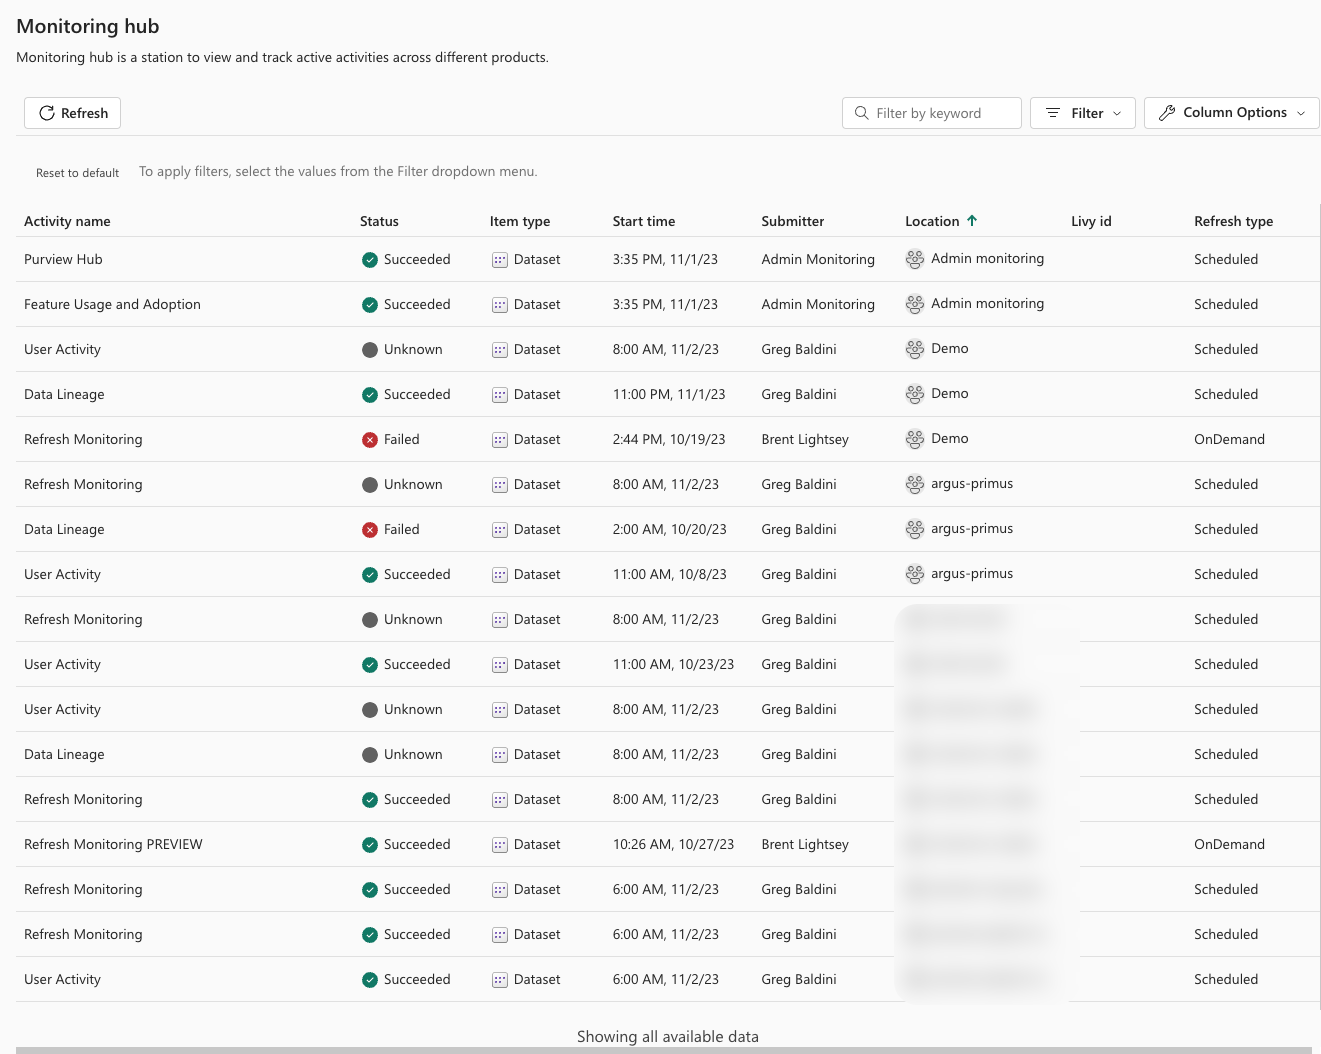
As we can see it shows each refreshable object one time, and the last time it refreshed. This will show datasets, datamarts, and dataflows (gen2), though all we have displayed here is datasets. Looking into the "Column Options" box, there are several other attributes that could be relevant to achieve our goal.
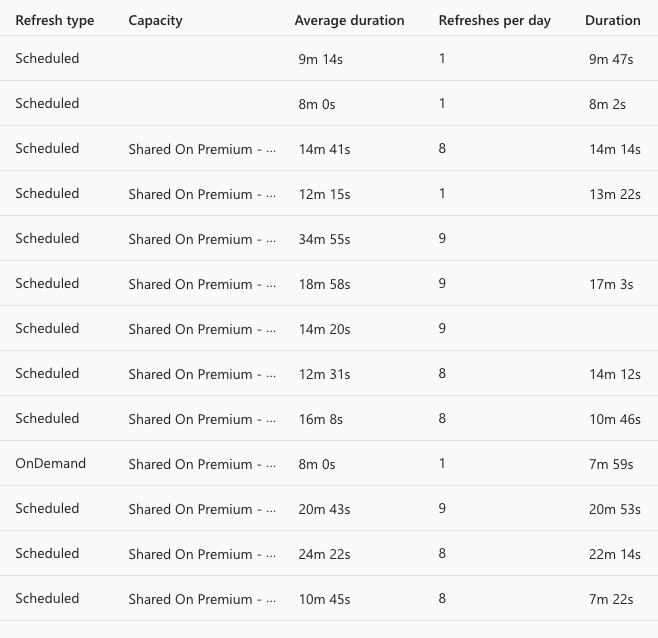
- The type of refresh (Scheduled or OnDemand)
- Capacity
- Average duration*
- Refreshes per day
- Duration (of the last refresh)
Using this information, what can we determine about concurrency?
To see Capacity Concurrency, you could arrange the columns as below and sort the view by Start Time to at least get a sense of what started near each other last time. That, combined with the refreshes per day and average duration, could give an intuitive sense of the resources required by each refresh and how many hours of each day they spend running.
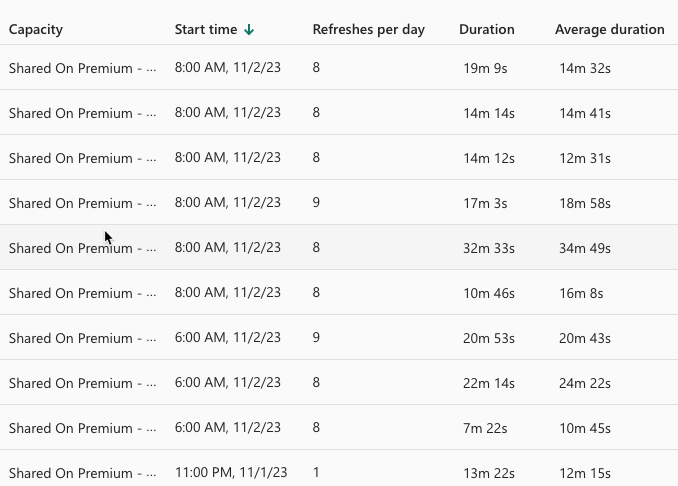
But it's still not really showing us a pattern or what is going to run at the same time in the future.
Regarding data source concurrency, we can't really determine anything directly and exclusively from this data.
Capacity refresh summary in the Admin Portal
On the Refresh summary screen here, we see the last time each dataset was refreshed. It is only datasets in this case.
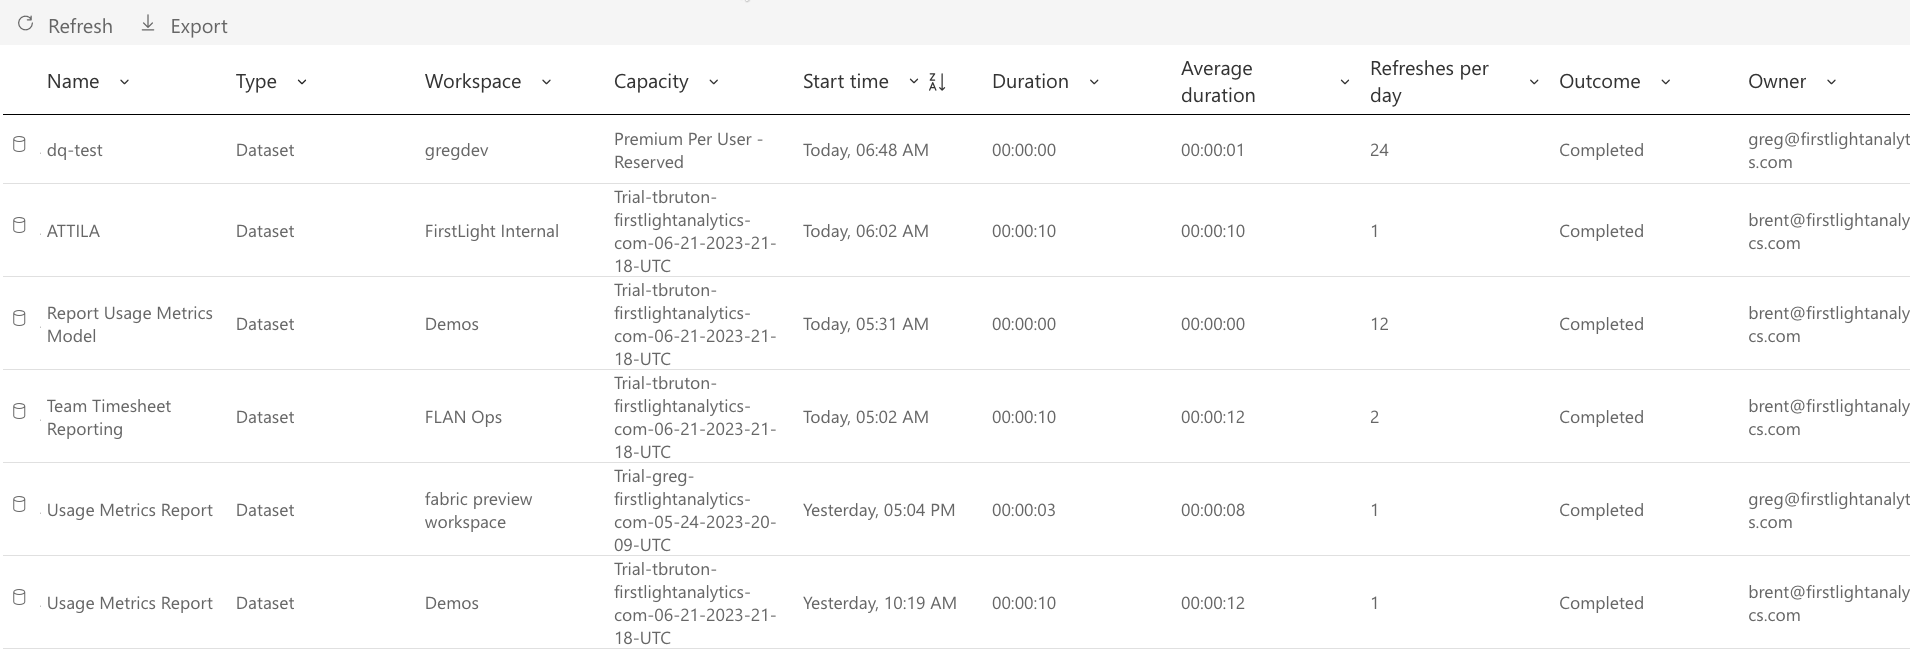
By sorting by Start time, we could perhaps see what was occurring at the same time. This has a second view at the top called "Schedule" instead of "History", let's see what we can accomplish with that.
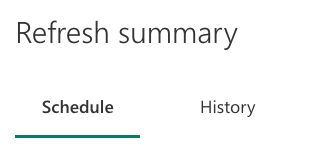
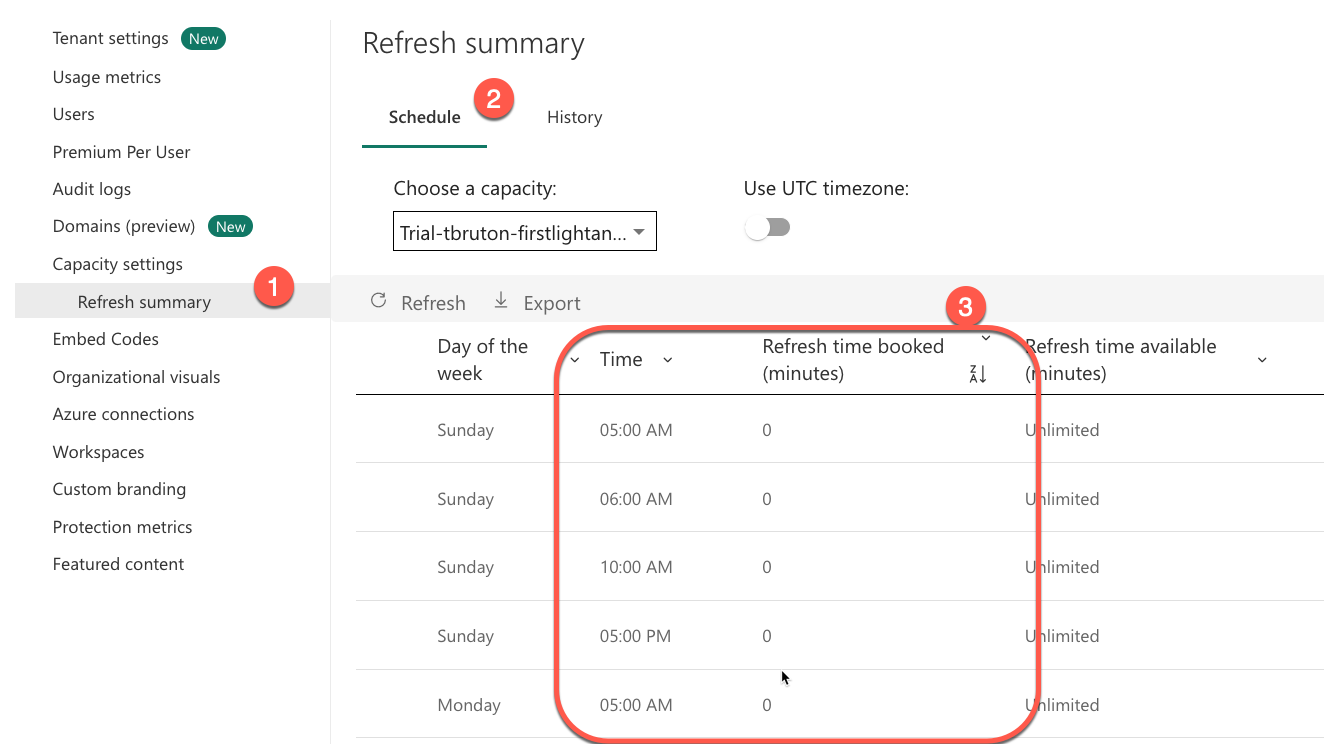
In this view, you can choose a capacity. You are given 336 rows, which corresponds to every half hour time slot in a 7 day week (7 * 24 * 2 = 336). This is giving us at least a glimpse into the loads we can expect for our capacity. Our workload is quite light here, so the booked time always adds up to 0 minutes:
Some limitations to keep in mind about this view:
- This is only capturing datasets, not dataflows or datamarts.
- This is only showing us a single dataset at a time, not the full refresh history in one place.
- The retention here is showing an average 60 day period - history beyond that point is discarded.
Required data
If we really want to understand and anticipate the impact of refresh concurrency, we need to collect the following data points over all-time:
- Refresh history for datasets:
- Workspace
- Dataset
- Start time
- End time
- Refresh history for dataflows (same attributes above).
- Refresh history for datamarts (same attributes above).
- The lineage mapping of all datasets, dataflows, and datamarts to datasources.
Report
Once we have this information collected, we can visualize it as a matrix showing a heat map of average daily refresh counts, organized by data source.

This displays the data sources on the rows, grouped by type. On the columns, we show "time buckets" grouped first by hour and then by half hour. We like 30 minute time buckets, because this aligns with the maximum frequency configurable in the Service GUI.
In frequent refresh scenarios, more granularity could be required, but could be added as another level in the drill down. Here's what it looks like expanded.

It is likely reasonable to bucket to as small a bucket as 5s, though display will become difficult.
It would be helpful to analyze by...
- Days in the week, so you can see your heaviest workload days created by Power BI.
- To see the average refresh duration for these refresh counts, so you can get a sense of the magnitude or complexity of the refreshes themselves.
- To be able to see the details of all refreshes, so you can know exactly what is going on.
- And to filter by the refreshable object type: dataset, dataflow, or datamart.
Tools and solutions
Here are other tools that could be helpful in collecting and processing the information you need. We have not vetted that all of these tools do this analysis, but they would help you collect the necessary information.
API interaction
For working with the API to pull the refresh history, these resources may be helpful:
- Official Docs for "Datasets - Get Refresh History In Group" API
- The Power BI API PowerShell Cmdlets
- Gerhard Brueckl's VSCode extension to call the Power BI APIs
Open Source solutions
- pbimonitor project on GitHub from Rui Romano
- powerbiscannermetadata data flow project on GitHub from Tommy Puglia
- Power BI Monitor ADF pipeline from Just B
Commercial
The reports we illustrated above come from Argus PBI, which can configure monitoring about refreshes, User Activity, and Data Lineage in a turnkey solution.
Argus includes a preview report addressing exactly this issue for datasets. (Dataflows coming soon). For more information, or for a 30-day risk-free trial, visit their website below.

Disclaimer: The editors of Power BI Ops have a commercial interest in Argus PBI.


